
Demo: ask-sweden.gssonhannes.workers.dev
Last week there was a fire 500 meters from Solna kraftstation. It was contained.
But what if it hadn’t been?
That fire, if it had spread, would have threatened power to Danderyds sjukhus. The hospital has 6 hours of backup. But Brista fjärrvärme supplies heat to Norrvikens vattenverk, which supplies water to Danderyds. 450 beds. The region’s largest emergency room. A fire in Solna becomes a hospital without water.
~20 hours over a weekend. I built a tool to trace these cascades.
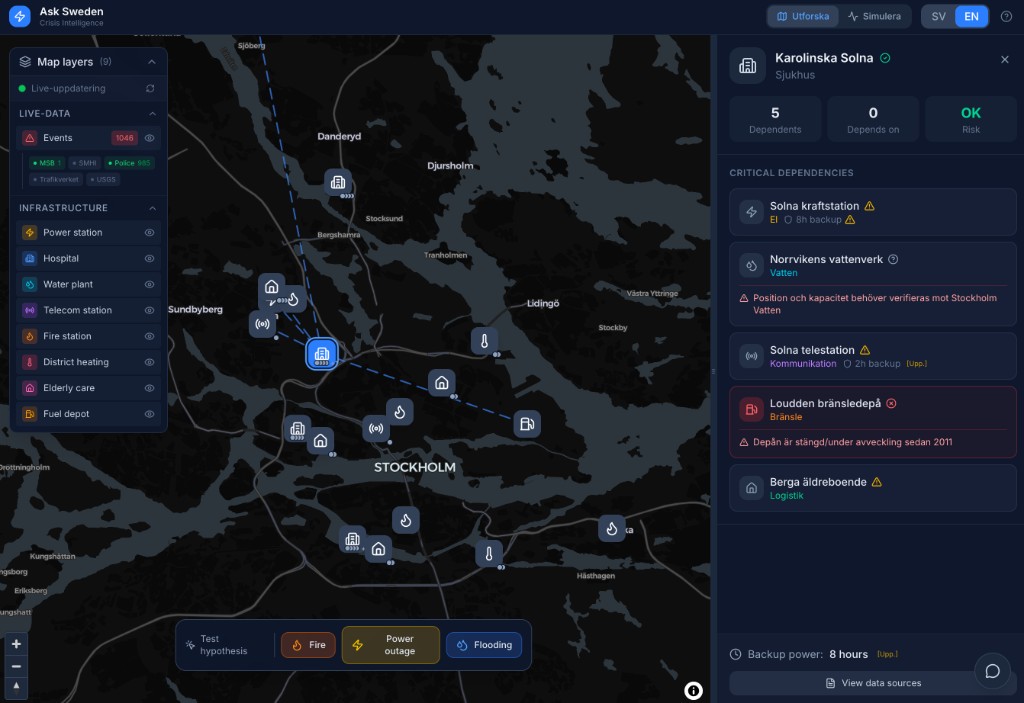
Karolinska Solna’s dependency panel: Solna kraftstation (8h backup), Norrvikens vattenverk, Solna telestation (2h backup).
Why This Works in Sweden
Two things made this possible.
First: offentlighetsprincipen. Sweden’s constitutional principle of public access means incident reports, infrastructure locations, and capacity data are accessible to anyone. MSB publishes real-time alerts. Municipalities publish infrastructure maps. Most countries can’t build this—the data is classified or fragmented. Sweden’s transparency infrastructure is underutilized.
Second: the right abstraction. I’d already built data ingestion—MSB, Polisen, SMHI, Trafikverket streaming to a map. I knew simulation tools existed: Simulink, AnyLogic. But raw incidents are just dots. Simulations without real inputs are just hypotheticals.
Then a fire got reported near Solna kraftstation. What if I could take that event—timestamped, geolocated—and ask what it means for the hospital 3km away?
Infrastructure as a dependency graph. Real-world events inject risk into nodes. A hospital depends on power. Power depends on fuel. Each node has a backup time. A cascade is breadth-first traversal where failure propagates with delay.
Hypothesis: Can a citizen build this in a weekend with public data?
Result: Yes, with caveats.
The Simulation Engine
flowchart LR
    subgraph sources["Sources"]
        MSB[MSB]
        POL[Polisen]
        SMHI[SMHI]
        TRF[Trafikverket]
    end

    subgraph core["Core"]
        API[Aggregator + Geocoding]
        GRAPH[(Dependency Graph)]
        SIM["Simulation"]
    end

    subgraph client["Client"]
        MAP[Map]
        PANEL[Risk Panel]
        FLOW[React Flow]
    end

    MSB --> API
    POL --> API
    SMHI --> API
    TRF --> API
    API --> GRAPH
    GRAPH --> SIM
    SIM --> MAP
    SIM --> PANEL
    SIM --> FLOW
React Flow for graph visualization. Discrete time-step simulation running client-side. ~50 lines of TypeScript:
function step(state: SimulationState, edges: Edge[], dt: number): SimulationState {
  const sorted = topologicalSort(state.nodes, edges);
  const newNodes: NodeState[] = [];

  for (const node of sorted) {
    const inputs = gatherInputs(node, edges, newNodes);
    const { output } = transferFunctions[node.type](inputs, node);
    newNodes.push({ ...node, output });
  }

  return { t: state.t + 1, nodes: newNodes };
}
Each node type has a transfer function: output as f(inputs). Hospital at 100% with power. Power drops → backup. Backup depletes → 30% capacity.
How Risk Propagates
Event → Node Risk
Hypothetical event on map → risk calculation for nearby nodes:
- : event-type × node-type matrix (fire near fuel depot = 0.95, fire near hospital = 0.15)
- : Haversine distance in km
- km decay constant
- if backup exists, else
- : severity multiplier (1.0, 1.2, 1.5)
Exponential decay is key: 500m is dangerous, 5km is noise.
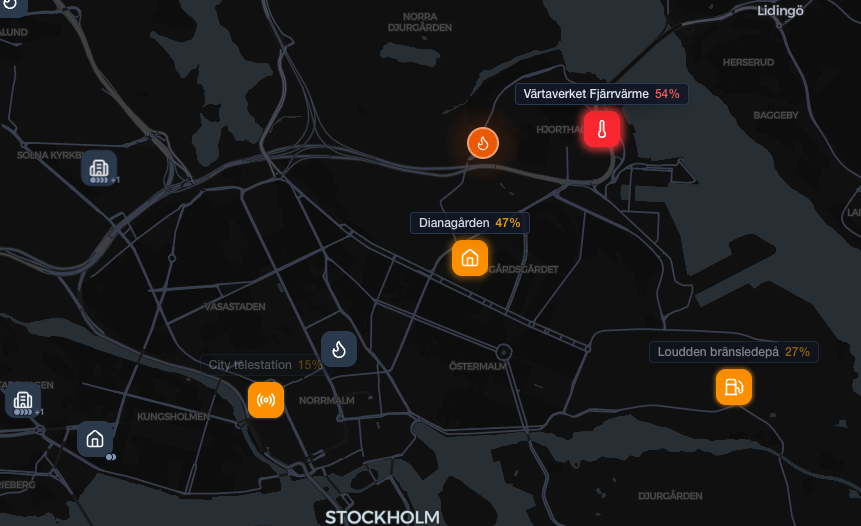
Fire near Värtaverket. District heating at 54%, elderly care at 47%, telecom at 15%.
Backup Depletion
Linear depletion when primary input fails:
- if power
- if
- otherwise
Cumulative tracking: lose power, regain briefly, lose again → continues from where it left off.
Output Aggregation
Multiple dependencies aggregate via min:
Node is only as healthy as its weakest dependency. Power but no heating in January = crisis.
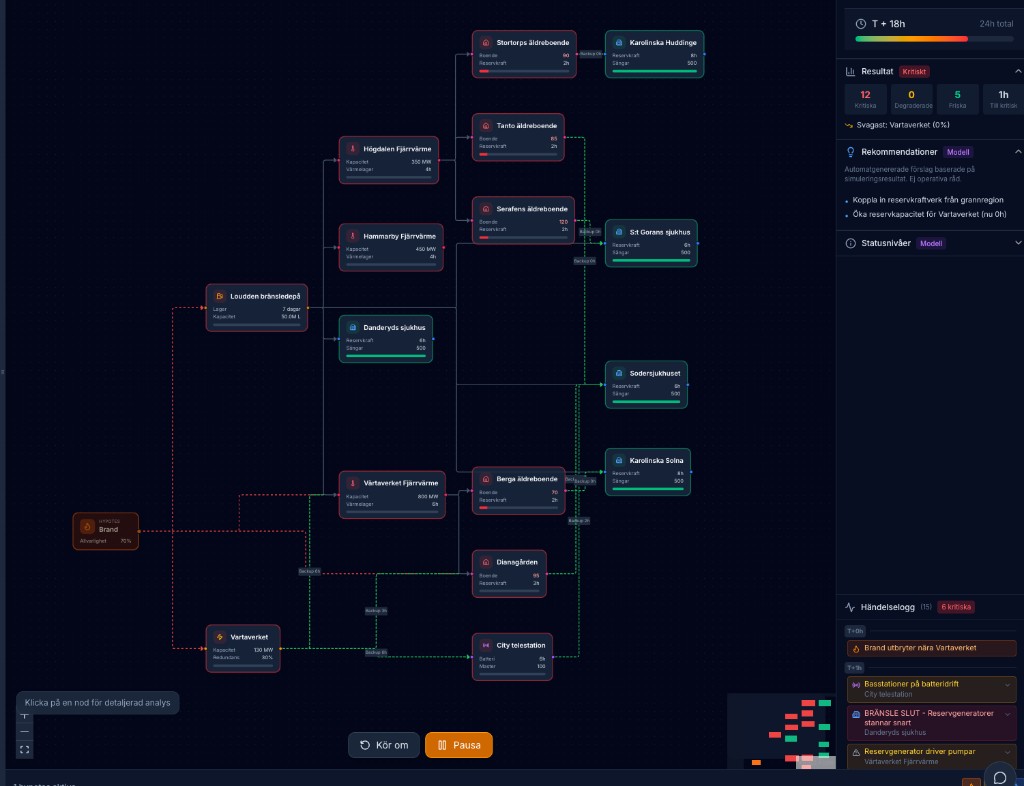
T+18h. Red = critical, orange = degraded.
Where the Model Breaks
What’s public: hospital locations, power station names, district heating plants, telecom towers.
What’s not: actual dependency relationships, backup capacities, grid redundancy, real-time utilization.
Educated guesses from MSB reports, news articles (“Danderyds lost power for 3h in 2019”), reasonable assumptions.
Result: Directionally correct, not operationally accurate. Good for “what if.” Not for actual crisis planning.
Confidence badges in UI: verified, estimated, outdated. Transparency about uncertainty beats false precision.
What the Simulations Showed
Dozens of scenarios. Three patterns.
1. The 6-hour threshold. Before 6h, cascades stay contained. After, secondary failures trigger—heating shuts down, water degrades, telecom dies. MSB guidance: 72h backup. Most facilities: 6-8h. Gap is 10x.
2. District heating is fragile. Power grid has redundancy. District heating doesn’t—fewer plants, longer restart, everything downstream depends on it. January cold snap: heating failure cascades faster than power failure.
3. Elderly care fails first. Expected hospitals. Wrong. Hospitals have robust backups, redundant feeds, trained staff. Elderly care: 2-4h backup, dual dependency on heat and power, residents can’t self-evacuate. Hits critical 2-4h before hospitals.
Try It
ask-sweden.gssonhannes.workers.dev
Place a hypothesis. Watch risk propagate. Step through the cascade.